Navigating the Inflationary Labyrinth: Deciphering Second-Order Tariff Effects and Divergent Price Signals
- lx2158
- Aug 14, 2025
- 10 min read

Updated: Aug 23, 2025


The contemporary macroeconomic landscape is characterized by a profound and unsettling tension. Despite one of the most aggressive monetary tightening cycles in modern history, inflation has proven stubbornly persistent, defying conventional models and challenging central bank orthodoxies. The United States economy now appears to be at a critical inflection point, transitioning from the primary, observable impacts of geopolitical trade policies to their more latent, complex, and potentially more pernicious second-order effects. The simple narrative of a post-pandemic demand surge meeting supply bottlenecks is giving way to a more intricate story, one in which structural cost pressures, driven by protectionist trade measures, are becoming embedded within the economy’s productive core.
This article dissects the widening and analytically crucial divergence between producer and consumer price indices, a schism that offers a real-time proxy for the compression of corporate profit margins. By examining the information embedded within the term structure of market-based inflation expectations—from the agitated short-term swaps to the more anchored long-term forwards—we can illuminate the market’s assessment of this evolving risk. We will argue that the recent, sharp acceleration in producer inflation is not an aberration but a harbinger of a new inflationary phase. This phase is characterized by the pass-through of sustained cost increases, a dynamic that threatens to reignite consumer price pressures, complicate the Federal Reserve's policy calculus, and fundamentally challenge equity market valuations predicated on stable, predictable corporate earnings.
The Producer Price Conundrum: A Harbinger of Sustained Inflationary Pressure
The most recent Producer Price Index (PPI) data, which registered a startling increase that was more than double the most pessimistic consensus forecast, serves as a crucial analytical signal. In the lexicon of inflation analysis, such a sharp deviation is not mere statistical noise; it is a message from the economy's supply side that the inflationary impulse is far from extinguished. This development indicates a critical shift in the nature of the inflationary environment. The economy has largely metabolized the first-order effects of recent tariff regimes—transitory phenomena such as anticipatory stockpiling, the immediate repricing of targeted imports, and initial shifts in consumer spending patterns. We are now confronting the far more complex second-order impacts, a risk vector rooted in the deep integration of intermediate goods within modern production networks.
The Theoretical Underpinnings of Price Transmission
The transmission of costs from producers to consumers is a cornerstone of price theory. In a canonical cost-push inflation model, producer costs are a primary input for the final retail price level. The relationship can be formalized in an econometric model that captures the dynamics of pass-through over time, accounting for both supply-side shocks and the state of aggregate demand. A vector error correction model or a simpler autoregressive distributed lag (ADL) model can be specified as: ΔP_t^c = α + Σ(β_i ΔP_{t-i}^p) + Σ(γ_j ΔY_{t-j}) + λ(P_{t-1}^c - θP_{t-1}^p) + ε_t.
Theory Explained: The Autoregressive Distributed Lag (ADL) ModelThe ADL model is a powerful statistical tool used in macroeconomics to understand how one variable (like consumer inflation, ΔP_t^c) responds over time to changes in another variable (like producer inflation, ΔP_t^p), while also accounting for its own past behavior (the "autoregressive" part). The λ(P_{t-1}^c - θP_{t-1}^p) term is a crucial feature known as the error-correction mechanism. It measures how far the two price levels have strayed from their long-term equilibrium relationship and acts like a gravitational pull, ensuring that consumer prices eventually adjust back toward fundamental costs over time.
Where:
ΔP_t^c represents the rate of change in the Consumer Price Index (CPI).
ΔP_t^p is the rate of change in the Producer Price Index (PPI).
ΔY_t is the output gap, a measure of aggregate demand pressure.
The coefficients β_i capture the short-run pass-through elasticity of producer prices to consumer prices over n periods, indicating how much of a cost shock is transmitted and with what lag.
The coefficients γ_j measure the sensitivity of inflation to demand conditions.
The term λ(P_{t-1}^c - θP_{t-1}^p) is an error-correction mechanism, which captures the long-run cointegrating relationship between the price levels, ensuring that consumer prices eventually adjust to fundamental costs, where θ is the long-run pass-through coefficient.
The current economic environment is defined by the acute stress being placed on the ΔP_t^p term. Tariffs function as a tax on specific inputs. Initially, their impact is isolated. However, as these taxed goods—be they steel, semiconductors, or specialty chemicals—are used as intermediate inputs in a vast array of domestic manufacturing processes, their cost-raising effect cascades through the supply chain. This is the essence of the second-order effect: a localized price shock morphs into a generalized increase in the economy's aggregate cost structure. This process risks initiating more dangerous wage-price dynamics, where persistent cost-of-living increases fuel demands for higher nominal wages, which in turn raise labor costs for firms, adding further fuel to the inflationary fire.
The Widening Gap: A Barometer of Corporate Distress
The growing divergence between the year-over-year growth in PPI and CPI is perhaps the single most important chart for understanding the current macro-financial risk. This spread can be viewed as a macroeconomic proxy for the aggregate profit margin of the non-financial corporate sector. When PPI inflation outpaces CPI inflation, as it is doing now, it implies that corporate input costs are rising faster than their output prices.
The profit, Π, of a representative firm can be expressed as: Π_t = (P_t^c ⋅ Q_t) - (C_t ⋅ Q_t). Where P_t^c is the output price (related to CPI), C_t is the unit cost of production (related to PPI), and Q_t is the quantity of output sold. The unit profit margin is (P_t^c - C_t). When the growth rate of PPI exceeds that of CPI, this margin is mechanically compressed.
For months, corporations have been absorbing these higher costs. This "absorption phase" is often a strategic choice in the face of uncertainty. Firms may be hesitant to alienate customers with price hikes if they believe the cost pressures are transitory, or they may prioritize maintaining market share in a competitive environment. However, this strategy is finite. Corporate balance sheets can only absorb margin compression for so long before profitability targets are breached, alarming shareholders and creditors.
The economy is now approaching the precipice of the "pass-through phase." Faced with persistently elevated input costs, firms will be compelled to pass these costs onto consumers to defend their margins. This impending spillover from producer to consumer prices represents the most significant upside risk to the inflation outlook. It suggests that the disinflationary progress seen in recent months may have been illusory, predicated not on a fundamental cooling of the economy but on a temporary and unsustainable squeeze in corporate profits.
Market-Based Expectations: A Tale of Two Tenors
To gauge the market's anticipation of this pass-through effect, we turn to the rich information embedded in inflation derivatives markets. These markets provide a forward-looking, real-time assessment of the collective beliefs of sophisticated investors regarding the future path of inflation.
The Inflation Swap Market: A Primer
An inflation swap is a derivative contract through which one party agrees to pay a fixed interest rate in exchange for receiving a floating payment linked directly to the realized rate of inflation (typically CPI) over the contract's life. The fixed rate of this swap, known as the "breakeven" or swap rate, represents the market's ex-ante expectation of the average rate of inflation for that tenor. It is a pure play on inflation, stripped of the liquidity and risk premia found in Treasury Inflation-Protected Securities (TIPS).
The pricing logic dictates that the fixed rate K is set such that the net present value of the contract is zero at inception: E[Σ(e⁻ʳᵗᵗ (CPI_t/CPI_{t-1} - 1 - K))] = 0. This implies that K is the market's unbiased estimate of the average geometric rate of CPI inflation over the period T, adjusted for an inflation risk premium.
Short-Term Jitters vs. Long-Term Anchoring
An analysis of the term structure of these expectations reveals a fascinating dichotomy.
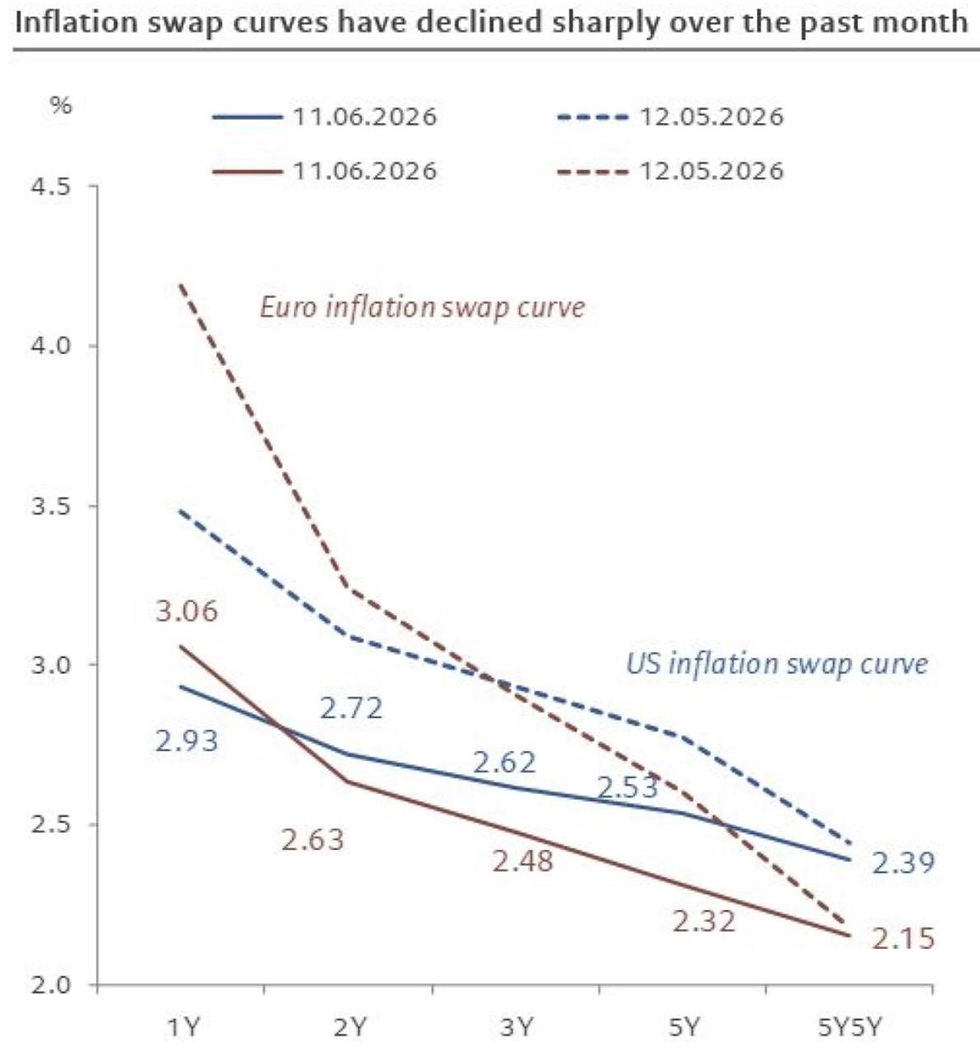
The Short-Term View: The one-year inflation swap rate, currently standing at 3.35% as of mid-August, is significantly elevated above the last reported year-over-year CPI reading of 2.7%. This positive premium of approximately 65 basis points is the market's quantification of the near-term upside risk. It reflects a clear expectation that the surge in producer costs and the ongoing impact of tariffs will indeed translate into higher consumer prices over the coming twelve months. The market is not merely extrapolating recent trends; it is actively pricing in the impending pass-through from the PPI-CPI gap.
The Long-Term View: In contrast, longer-term measures of inflation expectations remain more contained, or "range-bound." The 10-year inflation breakeven and the 5-year, 5-year forward inflation swap rate—a crucial gauge of the central bank's credibility which measures expectations for the five-year period beginning five years from now—have not exhibited the same dramatic upward lurch. This suggests that while the market anticipates a near-term inflationary bump, it still largely believes that the Federal Reserve will ultimately succeed in steering inflation back towards its long-run target. The formula to derive the forward rate (F₅,₅) from 5-year and 10-year zero-coupon swap rates (R₅ and R₁₀) is: F₅,₅ = (((1+R₁₀)¹⁰ / (1+R₅)⁵))^(1/5) - 1. The relative stability of this metric is a vote of confidence in the Fed's long-term resolve.
However, even this long-term anchor is showing signs of strain. Following a recent, weaker-than-expected US employment report, 10-year inflation expectations rebounded from their lows to 2.5%. This counterintuitive reaction—where a sign of economic weakness leads to higher inflation expectations—is profoundly important. It hints at market fears of a stagflationary policy error.
Theory Explained: StagflationStagflation is a portmanteau of "stagnation" and "inflation," describing a toxic economic condition of slow economic growth, high unemployment, and rising prices. It poses a severe dilemma for policymakers because the tools used to fight inflation (raising interest rates) can worsen unemployment and stagnation, while policies to boost growth (lowering interest rates) can further fuel inflation.
The market may be interpreting labor market weakness as a factor that will constrain the Federal Reserve's ability to maintain a restrictive policy stance. If the Fed is forced to pivot towards supporting growth before its inflation mandate is definitively achieved, it could entrench inflation at a higher level for longer, a risk the long end of the curve is beginning to price in. Furthermore, the fact that inflation expectations have remained resilient despite a significant slump in oil prices reinforces the thesis that the current inflationary impulse is structural, stemming from core costs and trade policy rather than volatile energy components.
Implications for Monetary Policy and Asset Markets
This complex inflationary backdrop, characterized by a cost-push shock and ambiguous signals from the real economy, creates a formidable challenge for monetary policy and poses a direct threat to financial asset valuations.
The Central Bank's Dilemma
The Federal Reserve is caught in a difficult bind. The divergent data points pull its optimal policy function in opposing directions. The classical Taylor Rule provides a useful framework for illustrating this dilemma.
Theory Explained: The Taylor RuleThe Taylor Rule is a guideline for monetary policy that prescribes how a central bank should set its benchmark policy interest rate. It's a formula that suggests the rate should be adjusted based on how far current inflation is from its target, and how far economic output is from its full potential. It provides a systematic way to think about balancing the dual mandate of price stability and maximum employment.
The rule can be expressed as: i_t = π_t + r* + α_π(π_t - π*) + α_y(y_t - ȳ_t). Where i_t is the target policy rate, π_t is current inflation, r* is the neutral real rate, π* is the inflation target, and (y_t - ȳ_t) is the output gap.
The shockingly high PPI data and the risk of its pass-through to CPI increase the value of π_t, arguing for a higher policy rate via the term α_π(π_t - π*).
Conversely, the weak employment report suggests a widening negative output gap, which argues for a lower policy rate via the term α_y(y_t - ȳ_t).
This is the textbook definition of a supply-side shock, which simultaneously raises inflation and dampens economic activity. An attempt to combat the inflation will worsen the recessionary dynamic, while an attempt to stimulate growth will exacerbate inflation. The Fed is thus forced to navigate a treacherous path, risking a policy mistake in either direction.
Equity Market Vulnerability
For equity markets, the situation is precarious. Valuations are, at their core, a function of expected future earnings and the discount rate applied to those earnings. The current environment attacks both pillars of valuation.
Earnings Compression: The widening PPI-CPI gap is a direct assault on corporate profitability. As argued, this margin squeeze is unsustainable. The consequence is either a significant hit to future earnings per share (EPS) as companies continue to absorb costs, or a surge in CPI as they pass them on, which would force the Fed to tighten policy further. Either outcome is negative for equities.
Valuation Multiples: The impact on valuation multiples is twofold.
Discount Rates: In a Dividend Discount Model (DDM) framework, the price (P₀) of a stock is the present value of its future dividends (D_t), discounted by a rate (k) that reflects the risk-free rate and an equity risk premium (ERP), less a growth rate (g): P₀ = Σ(E(D_t) / (1+k)ᵗ) ≈ D₁ / (k-g).
Theory Explained: The Dividend Discount Model (DDM)
The DDM is a classic method for valuing a company's stock. Its core idea is that a share is worth the sum of all future dividend payments the investor expects to receive. Because money today is worth more than money tomorrow, these future dividends are "discounted" back to their present value. The model is highly sensitive to the discount rate (k) and the expected growth rate of dividends (g).
Increased macroeconomic uncertainty and the potential for a policy error raise the ERP component of k, forcing investors to demand higher compensation for bearing equity risk. This higher discount rate mechanically lowers the present value of future cash flows.
Growth Expectations: Margin pressure and a potentially slowing economy also lead to downward revisions of long-term earnings growth expectations (g), further reducing calculated intrinsic value.
The ultimate test for markets in the coming quarters will be the velocity and magnitude of the PPI-to-CPI pass-through. A rapid transmission will confirm the market's stagflationary fears, likely forcing a hawkish policy response and triggering a significant equity market de-rating. A slower, more muted transmission would imply that corporations have found ways to offset costs or that demand is sufficiently weak to prevent price hikes, a scenario that would still weigh heavily on earnings but might afford the Fed more patience.
Conclusion
The United States economy is navigating a new and challenging inflationary paradigm. The linear, demand-driven inflation models of the past are insufficient to explain a dynamic now heavily influenced by structural, supply-side frictions emanating from geostrategic trade policy. The sharp divergence between producer and consumer price inflation is the most salient feature of this new landscape, serving as a clear leading indicator of the immense pressure on corporate profit margins.
While long-term inflation expectations remain tentatively anchored—a testament to the Federal Reserve's hard-won credibility—the short-term derivative markets are flashing unambiguous warnings of a looming pass-through of these costs to the consumer. This creates a perilous environment for a central bank already struggling to balance its dual mandate against a backdrop of weakening real economic activity. For investors, the message is clear: the era of placidly expanding margins and predictable monetary policy is over. The widening chasm between what companies pay and what they can charge is a fault line running directly beneath the foundation of current equity valuations, and the tremors are just beginning. The coming months will be a crucial test of corporate resilience, policy dexterity, and market fortitude in the face of an inflation problem that is proving to be structural, persistent, and profoundly complex.


Comments